AFM pleit voor Europese set aan kapitaalmarktendata
AFM pleit voor Europese set aan kapitaalmarktendata
.jpg")
De ontwikkelingen op de Europese kapitaalmarkten vragen in toenemende mate om een integrale, Europese toezichtaanpak. Dat stelt de AFM bij de publicatie van de tweede editie van het rapport ‘State of the Capital Markets’.
Volgens de toezichthouder zijn de aandelenmarkten het domein geworden van supersnelle internationale algoritmische handel, trekt de bedrijfsfinanciering via de Europese obligatiemarkten weliswaar aan – maar is deze nog altijd erg afhankelijk van banken – en kan de volatiliteit op de Europese energiemarkt zo weer de kop opsteken.
Hanzo van Beusekom, bestuurslid AFM: ‘Een gecentraliseerde EU-set aan kapitaalmarktendata staat hoog op onze agenda. Hiermee spoor je bijvoorbeeld eerder potentiële financiële risico’s en grensoverschrijdend marktmisbruik op. De meeste spelers op de Europese kapitaalmarkten zijn immers internationaal actief. Daarnaast blijft een nationale set aan kwalitatief goede data, zoals weergegeven in ons rapport, uiteraard noodzakelijk om ons data-gedreven toezicht op de Nederlandse kapitaalmarkten scherp te houden en te verbeteren.’
In 2022 publiceerde de AFM voor het eerst een overzicht van de Nederlandse kapitaalmarkten. De grafieken en tabellen in het in oktober 2023 verschenen rapport geven een meerjarenoverzicht van de ontwikkelingen en trends op de aandelen-, obligatie- en grondstoffenderivatenmarkten in Nederland.
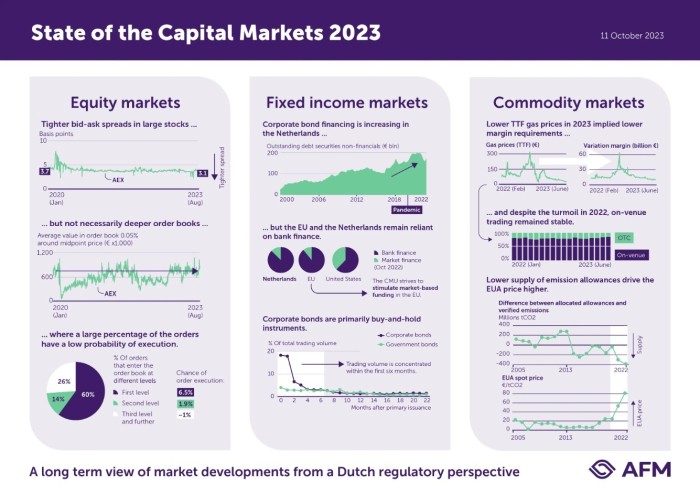
Explanation of the visualIn this visual we show graphs that demonstrate the state of the capital markets in 2023. Equity markets Figure 1: This graph shows tighter bid-ask spreads in large stocks, in basis points of the AEX from Jan 2022 – Aug 2023. Figure 2: However, the average value in order book 0.05% around midpoint price, from Jan 2022 – Aug 2023, does not show that order books have become deeper. Figure 3: A large percentage of the orders have a low probability of execution. The graph shows that, for example, 60% of all orders enter at the first level in the order book, of which only 6.5% is executed. Fixed income markets Figure 1: Corporate bond financing is increasing in The Netherlands, as shown in the outstanding debt securities of non-financials (in billion euro’s) between 2000-2022. Figure 2: However, the EU and The Netherlands remain reliant on bank finance, with a share of approximately 80%, as shown in two pie charts. The CMU strives to stimulate market-based funding in the EU. The US shows a larger share of market-based funding than the EU and the Netherlands. Figure 3. Corporate bonds are primarily buy-and-hold instruments. The graph shows that their trading volume is concentrated in the first six months. Commodity markets Figure 1. Lower TTF gas prices in 2023 implied lower margin requirements. The two graphs show gas prices (TTF) in euro’s from Feb 2022-June 2023 and variation margin (billion euro’s) in the same period. Figure 2. Despite the turmoil in 2022, on-venue trading remained stable. The graph shows a stable share of OTC (around 25%) and on-venue (around 75%) from Jan 2022-June 2023. Figure 3. Lower supply of emission allowances drives the EUA price higher. The first graph shows the decreasing difference between allocated allowances and verified emissions in millions of tCO2, from 2005-2022 (supply). The second graph shows an increase of the EUA spot price in euro’s per tCO2 in the same period. |
Klik op de link hieronder om het volledige rapport te lezen:
Attachments
Share this post!
Related posts
-
 Read more about "Harry Geels: Global Titans conquer the world"
Harry Geels: Global Titans conquer the world
-
 Read more about "Bob Homan: Very surprising, how investors can be surprised"
Bob Homan: Very surprising, how investors can be surprised
-
Read more about "Bob Homan: Very surprising, how investors can be surprised"
Bob Homan: Very surprising, how investors can be surprised