SSGA SPDR: Three Recent ETF Trends in Greatly Uncertain Times

Matthew Bartolini, Head of SPDR Americas Research at State Street Global Advisors, outlines three recent ETF trends in the greatly uncertain times:
- Low stock and bond volumes from the ETF primary market activity should not be seen as exacerbating market moves.
- Trading volumes have increased across both equity and fixed income ETFs, hitting records.
- The rush to defensive ultra-short term government bond ETF exposures is outpacing 2018 levels.
This unprecedented time will no doubt spark furious academic debate, both from a humanitarian as well as a financial markets perspective – akin to the research that followed the great financial crisis and post-dot-com bear markets. Currently, I find myself cultivating rich data sets to help put market movements in context and chart how ETFs are performing. Of course, showcasing how ETFs are being used in this market will do little to quell the stress in our lives stemming from having our daily routines upended. However, hopefully my observations might ease any anxiety investors may have related to ETFs.
Low stock and bond volumes from the ETF primary market activity should not be seen as exacerbating market moves
Coming out of the crash of 1987, ETFs were created to allow investors to participate in the market, while limiting the impact on the securities held by the funds. Based on these levels, the same market impact holds today.
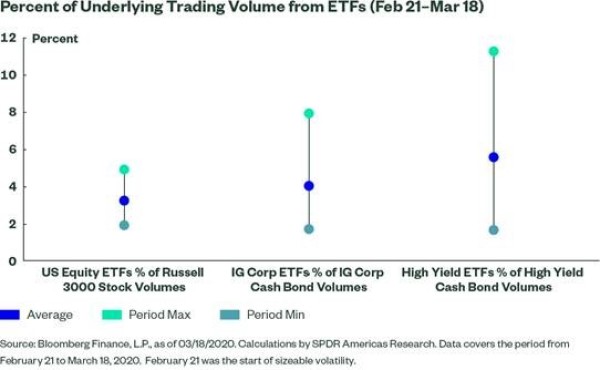
As shown below, gross primary market activity of US equities, high yield bonds, and investment-grade bonds as a percentage of their underlying market’s trading activity has averaged less than 6% since February 21, 2020. For US equities, I took any ETF with a geographic focus and compared it with the total volume of all Russell 3000 stock volumes. For the fixed income analysis, the underlying market is represented by FINRA TRACE data.
In addition to the average figures, the daily max and min are also placed in the chart. Only for high yield did this metric surpass 10% on a single day.
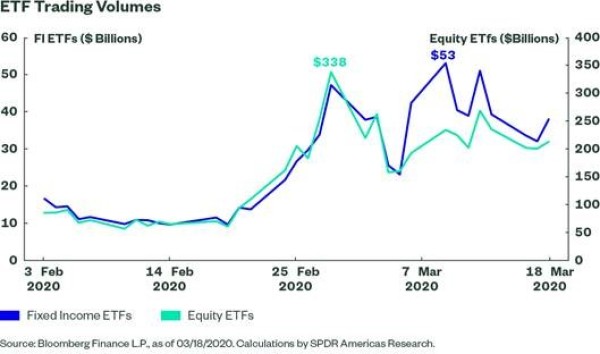
Trading volumes have increased across both equity and fixed income ETFs, hitting records
ETFs are being used to make real-time asset allocation decisions and provide liquidity at a time when investors demand it most. With the uptick in volatility, investors have gravitated toward ETFs as a result of their onscreen liquidity, leading to a heavy increase in trading volumes across a multitude of market segments. Both equity and fixed income ETF trading volumes have increased since February 21 and hit records, as illustrated in the chart below. Equity ETFs have traded, on average, $200 billion in the secondary market versus the normal average of $60 billion. Fixed income ETFs have traded an average of $37 billion – three times their normal average daily volume. Taken together, ETFs have represented 37% of all US exchange volume, versus the typical average of 26% (Source: Bloomberg Finance L.P. as of 3/18/2020. Calculations by SPDR Americas Research).
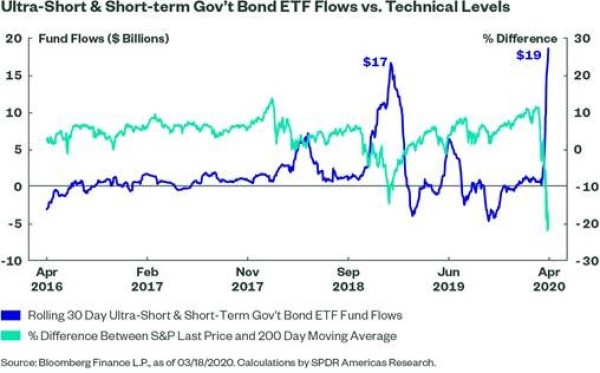
The rush to defensive ultra-short term government bond ETF exposures is outpacing 2018 levels
In this market selloff, there has been a lack of information, and therefore, no information advantage. As a result, we have seen broad-based de-risking across many asset classes and a gravitation toward defensive areas. From a positioning perspective, we have seen investors uniquely favor ultra-short and short-term government debt. To date in March, $17 billion has flowed into the ultra-short and short-term government debt ETF category, with inflows every day of the month. Inflows, in particular, picked up pace once key technical indicators (i.e., last price versus 200-day moving average) used by traditional trend-following equity strategies were breached, triggering a defensive shift. The chart below depicts the rolling 30-day fund flows for this group of ETFs, and the most recent 30-day period, not surprisingly, outpaces the timeframe from 2018 when the S&P 500 fell close to 20%.