eFront: Small buyout funds outperforming mega-buyouts
eFront: Small buyout funds outperforming mega-buyouts

The latest research from eFront, the leading financial software and solutions provider dedicated to Alternative Investments, has thrown into sharp relief the differences in deployment and distribution characteristics of US LBOs funds.
Analysis shows that small cap LBO funds are more profitable than funds that focus on target companies of larger market capitalization. In addition, small cap funds deploy capital at a faster rate and reinvest a significantly higher proportion of fund sizes than other funds. They also continue to invest significantly until year eight of the fund cycle, against a normal investment period of five years, and distribute capital much earlier than medium, large and mega cap LBO funds.
Given these findings, it could be tempting to conclude that smaller cap LBO funds are more attractive than large and mega cap funds when looking at distributions. However, knowing that capital contributions are also significantly higher, and that capital might be significantly recycled, the overall picture is more nuanced.
Indeed, if mega cap LBO funds seem less profitable, they also have attributes which might make them appear as less risky. In particular, they provide predictable streams of cash flows. Contributions are essentially limited to the first five years of activity of the fund and distributions are largely done by year ten. Given these attributes, patient investors that are willing to handle greater risk and more fluctuations in terms of capital inflows and outflows might better suited to looking at smaller cap LBO funds.
Tarek Chouman, CEO of eFront, commented:
“The debate surrounding the performance of US LBO funds and its expected evolution can at times hide a more nuanced and granular perspective. Looking at the funds according to the size of the transactions they operate at introduces an interesting perspective. Notably, it is clear that mega LBO funds are not representative of the overall LBO sector.”
“Cash flow patterns uncover a wide diversity of activities, and counter-intuitively show that small cap LBO funds are extremely active in recycling capital and are likely to operate significant buy-and-build strategies. This shifts the debate to investor preferences and their perception of how adequate the return profile of each category of LBO funds is. Breaking down LBO funds in categories also hints at different risk profiles. This supports a more balanced view of the merits of each category of LBO funds.”
In depth: contributions, distributions and the J curve
Figure 1 – Cumulated contributions of US LBO funds, by size of deals
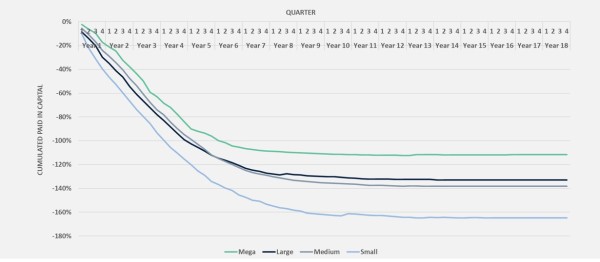
Source: eFront Insight, as of Q4, 2018.
Regardless of their size, US LBO funds share some common features. By Year 5, they are all fully invested. They all have a cumulated paid-in above 100% of the fund size. Fund managers recycle early distributions and reinvest them to compensate for the weight of costs and fees on performance. The shape of the curve is fairly similar, although the deployment is faster at the smaller end of the deal sizes.
Some notable differences appear as well. The most visible one is the scale of reinvestments. Counter- intuitively, small buyout funds deploy capital at a fast clip and reinvest a significantly higher proportion of fund sizes than other funds. This could be explained by recycling of capital; fund managers can reinvest in existing deals, notably to execute buy-and-build strategies. A manager executing a buy-and-build continues to invest well beyond the investment period.
It is more difficult to explain the particularly high level of paid-in to committed capital. The usual explanation is that early distributions are recycled to compensate for management fees and other costs. This allows the fund manager to effectively invest up to 100% of the fund size. However, management fees and costs usually account for 25 to 30% of the size of a fund. According to Figure 1, managers deploy more than double of that.
A possible theoretical explanation is that fund managers recycle capital not only to compensate for the weight of fees and costs but also to make new investments as long as they are in the investment period. This explanation is supported by the fact that managers of small LBO funds distribute more capital and faster (Fig. 2).
As deal size increases, the propensity of the fund manager to recycle distributions decreases. Mega LBO funds do not seem to recycle intensively early distributions, though they still compensate for fees and costs with an average paid-in to committed capital ratio of 112%.
Figure 2 – Cumulated distributions of US LBO funds, by size of deals

Source: eFront Insight, as of Q4, 2018.
Distributions follow a common pattern, regardless of the size of deals (Fig. 2), though smaller funds distribute capital earlier, and also continue distribute for longer. This is a logical consequence of the pattern of contributions; as smaller funds recycle earlier distributions, and thus continue to invest well beyond the usual investment period, holding assets longer.
Figure 3 – Cumulated cash-flows of US LBO funds, by size of deals
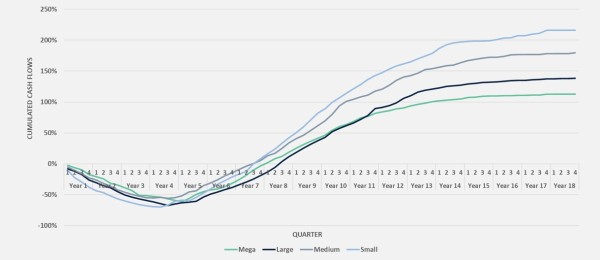
Source: eFront Insight, as of Q4, 2018.
The plotted J-curves provide an interesting picture, but the fact that contributions and distributions partially compensate one another hides the more detailed conclusions that a granular analysis provides (Fig. 3).
Small cap LBO funds return capital faster and appear to be more profitable. Medium LBO funds have the shallowest bottom of the J-curve and come second best in terms of performance. Large cap LBO funds are probably the most representative J-curve, as they reach the net bottom in Year 4 and recover regularly. The only exception is that they are the slowest to cross the break-even line, in Year 8 only, while the other strategies do in Year 7. Mega cap LBO funds reach the bottom on a net basis in Year 5 and appear to be the poorest performers with TVPI being 1.56 relative to 1.67 of small cap LBO funds. At the same time the spread between top and bottom quartile mega cap LBO funds is 0.67 which makes them significantly less risky than investing into small cap LBO funds that deliver the spread of 1.27.