BNY Mellon: Volatility And Seasonality (Part 2)
BNY Mellon: Volatility And Seasonality (Part 2)

Simon Derrick, Chief Currency Strategist, BNY Mellon
- Dips in equity market volatility in spring and summer are a recognizable pattern of behavior
- Pattern has been well-pronounced in recent years
Given the impact equity market volatility can have on sentiment in the FX markets, the idea of seasonality is worth exploring further.
The Big Picture
Over the 123 year history of the Dow Jones Industrial Average the second half of the year has proved rather more dangerous than the first, accounting for 60 of the top 100 monthly declines.
The average decline over these 60 months was 11.17%. The average decline over the 40 months that came during the first half of the year was only slightly less, standing at 10.79%.
May has proved the most dangerous month during the first half of the year (“sell in May and go away”) with nine appearances on the list and an average drop over these months of 12.15%. The worst decline came in May 1940 (21.7%) and coincided with the fall of France.
January, March and June each have seven appearances on the list with average losses of 7.79%, 11.83% and 10.22% respectively. The average losses for March were skewed by the 23% decline seen in 1938 following the annexation of Austria. February comes next on the list with just six appearances (only beaten by December and April) with an average drop over these of 10.27%.
April has seen the fewest appearances on the list, with just four. Although the average for these four is high (12.96%), this is skewed by the 23.4% drop seen in 1932 as the bear market reached its final phase.
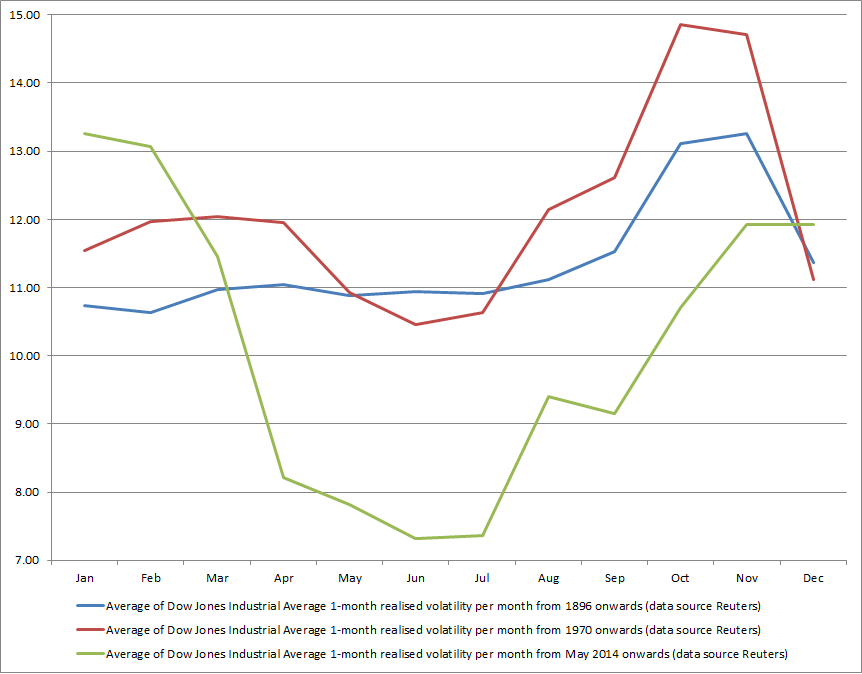
When looked at in term of realized volatility, this pattern of the two halves of the year seeing different patterns of behavior is also apparent. A rise in the average realized volatility for each month over the entire period since 1896 emerges in August and continues to a peak in November before subsiding at the end of the year.
Since 1970
If anything, the second half of the year has been rather more fraught with danger since 1970 with 31 of the top 50 monthly declines coming between July and December. The average decline seen over these 31 months was 8.5%. The average decline seen over the 19 months that featured on the top 50 list and came in the first half of the year was 7%.
January has proved the month in the first half of the year with most frequent number of appearances on the list (six, compared to four in February, three in both March and May, two in June and just one in April). However, June suffered the worst average declines in H1 (8.5%) followed by February (7.4%).
As might be expected, the pattern of average monthly realized volatility begins to look more familiar when looked at over the period since 1970. A distinct dip now becomes apparent in May, June and July before beginning to rise sharply in August before peaking out in October. Again volatility subsides in December.
The Last Five Years
It’s arguable that the pattern has shifted slightly in the five years since major central banks first began to introduce the concept of negative deposit rates. During this time there have been 17 months that have seen net losses with March and September suffering the greatest number (three apiece) while January and February saw the greatest average losses (over 4%).
At the opposite end of the scale, April, May and November have seen no net month losses during this time frame. However, while November saw an average gain of 2.75%, both April and May saw average monthly gains of less than 1%. This extremely muted behavior also stood in sharp contrast to the averages for the other months of the year, when they put in positive performances.
In terms of the pattern of average monthly realized volatility over the past five years the contrasts become even more marked when compared to the longer-run averages. Now the year splits up rather differently with volatility climbing from August to reach a peak in January and February only to collapse in April, May, June and July.
A Few Thoughts
It’s always worth reiterating that history does not necessarily provide a guide to what happens next. Nevertheless, given the cycle of the political and, to a lesser degree, the financial year, it isn’t overly surprising that distinct patterns of market behavior should emerge over the course of 12 months.
What is interesting is that, if anything, these patterns have been more observable over the past five years when compared to the longer-run averages for each month. In particular the lows in average realized volatility seen during the spring and summer over the past five years are particularly well defined.
Given that realized volatility in the USD Index has often shadowed volatility in equity markets over the past five years this seems a useful point to be aware of.
Share this post!
Related posts
-
 Read more about "Han Dieperink: The bull market is only halfway through"
Han Dieperink: The bull market is only halfway through
-
 Read more about "Nuveen: Groeiprognose Amerikaanse economie omlaag"
Nuveen: Groeiprognose Amerikaanse economie omlaag
-
 Read more about "Ethenea: Why 2026 could become a banner year for US IPOs"
Ethenea: Why 2026 could become a banner year for US IPOs
-
 Read more about "Bob Homan: Trump's paradox, when chaos leads to growth"
Bob Homan: Trump's paradox, when chaos leads to growth
-
 Read more about "Harry Geels: The three biggest dangers of Trump's BBB"
Harry Geels: The three biggest dangers of Trump's BBB
-
Read more about "Crédit Mutuel AM: Are we headed for a new financial crisis?"
Crédit Mutuel AM: Are we headed for a new financial crisis?
-
 Read more about "A lack of risk appetite in Europe"
A lack of risk appetite in Europe
-
 Read more about "Allianz Trade: EU slechts digitale kolonie van VS en Azië"
Allianz Trade: EU slechts digitale kolonie van VS en Azië
-
 Read more about "Fidelity: Europese ETF-markt herstelt, maar vooral VS profiteert"
Fidelity: Europese ETF-markt herstelt, maar vooral VS profiteert
-
 Read more about "J.P. Morgan Private Bank: Mid-Year Outlook 2026"
J.P. Morgan Private Bank: Mid-Year Outlook 2026