eFront: Private vs. public co-movements are stronger than you think
eFront: Private vs. public co-movements are stronger than you think

September 24, 2019 – The latest research from eFront, the leading financial software and solutions provider dedicated to Alternative Investments, shows that the evolution of multiples of US LBO funds and the movement of US stock indices are far more closely correlated than previously thought.
The correlation between the multiples of US LBO funds and the S&P 500 reaches 0.639 over the period from 1992 to 2018, while the figure for the Wilshire 5000 is 0.641.
In analyzing the evolution of returns of public and private markets, the first layer is to compare the volatilities of the two. During the entire period from 1992 to 2018, the standard deviation of US LBO funds’ performance was 0.0254. At the same time, the standard deviation of S&P 500 was exactly three times larger. Figure 1 shows that US LBO funds’ quarterly change in TVPI fluctuates much less than the returns on S&P 500 and Wilshire 5000 public market indices.
Figure 1 – Evolution of the TVPI of US LBO funds, the S&P 500 and the Wilshire 500
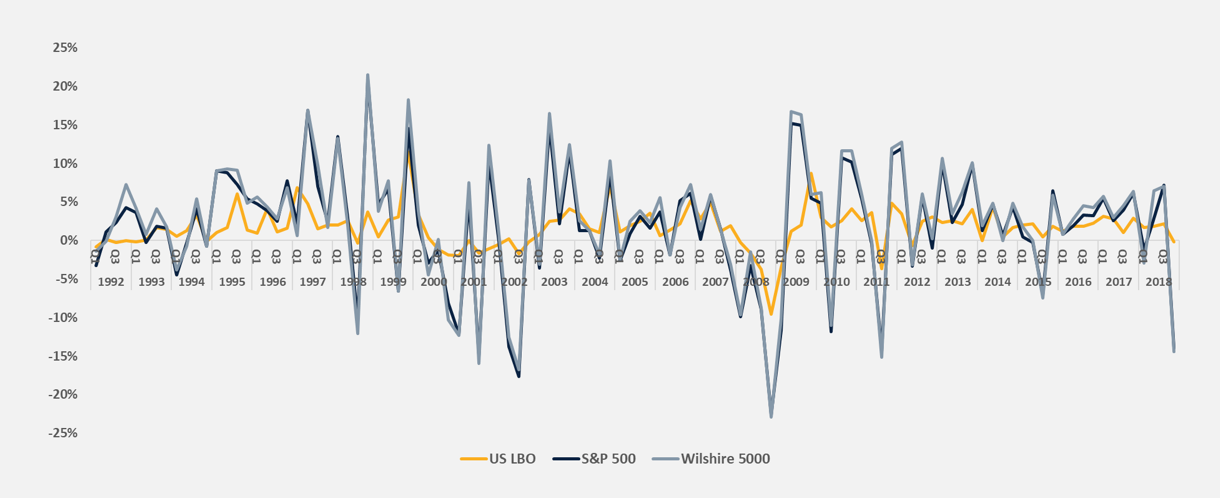
Source: CBOE, Federal Reserve of St. Louis, eFront Insight, as of Q1, 2019.
Though they have always been significant, the correlations increased over time. During the period 1992-2001, the correlation was 0.552 for US LBO funds and the S&P 500, and 0.556 for US LBO funds and the Wilshire 5000. It then increased to 0.707 and 0.709, respectively, during the period 2002-2011 and slightly decreased to 0.667 and 0.666 during the period 2012-2018. Looking specifically at the period following the introduction of the IPEV, that is to say, 2007-2018, the correlations were, respectively, 0.728 and 0.721.
Focusing on the earliest decade (Fig. 2), the one with the lowest correlations, a few phenomena appear. In Q1 and Q2 1994, the TVPI of US LBO funds increased, despite two successive quarters during which indices fell. The TVPI caught up in Q3 1995 with two strong progressions of the indices in Q1 and Q2 1995. The same phenomenon is visible in Q2 1995 and Q1 1997. However, the spikes of Q2 1997, Q1 1998, Q4 1998, and the drop of Q3 1998 are not fully reflected. In fact, one might argue that fund managers need to see two successive quarters of strong and consistent change to reflect it significantly in their TVPIs. The main philosophy is to adjust portfolio values moderately but in line with the indices, sometimes catching up with sustained strong movements.
Figure 2 – Evolution of the TVPI US LBO funds, the S&P 500 and the Wilshire 5000 (1992-2001)
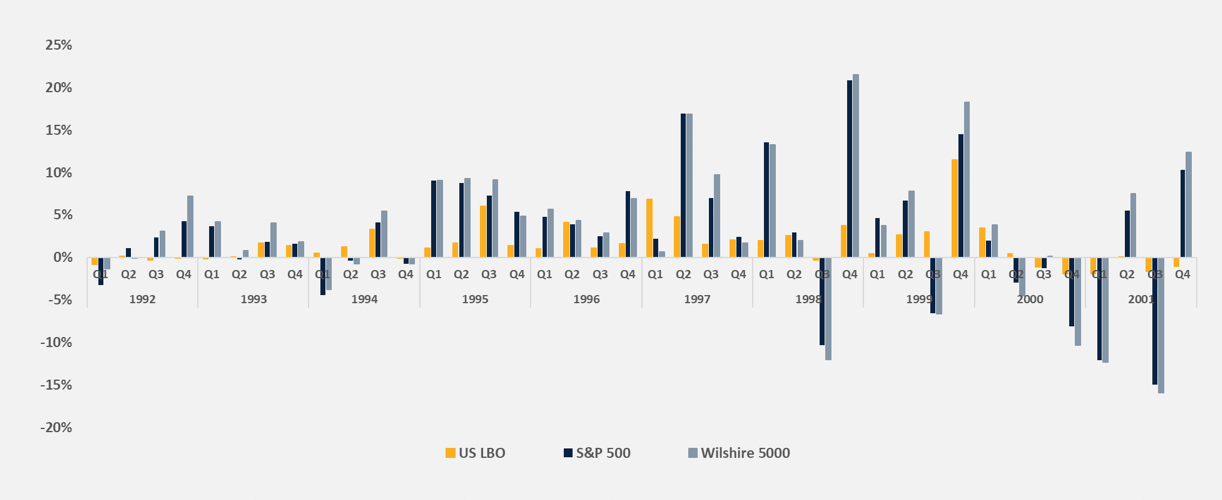
Source: CBOE, Federal Reserve of St. Louis, eFront Insight, as of Q1, 2019.
The conservatism of the NAV estimates would explain why, most of the time, the multiples react less than indices. This is particularly visible in the recovery of 2009-2013 and benign environment the world has experienced since 2014 (Fig. 3). The implementation of the fair market value does not seem to have changed this fact.
Figure 3 – Evolution of the TVPI US LBO funds, the S&P 500 and the Wilshire 5000 (2007-2018)
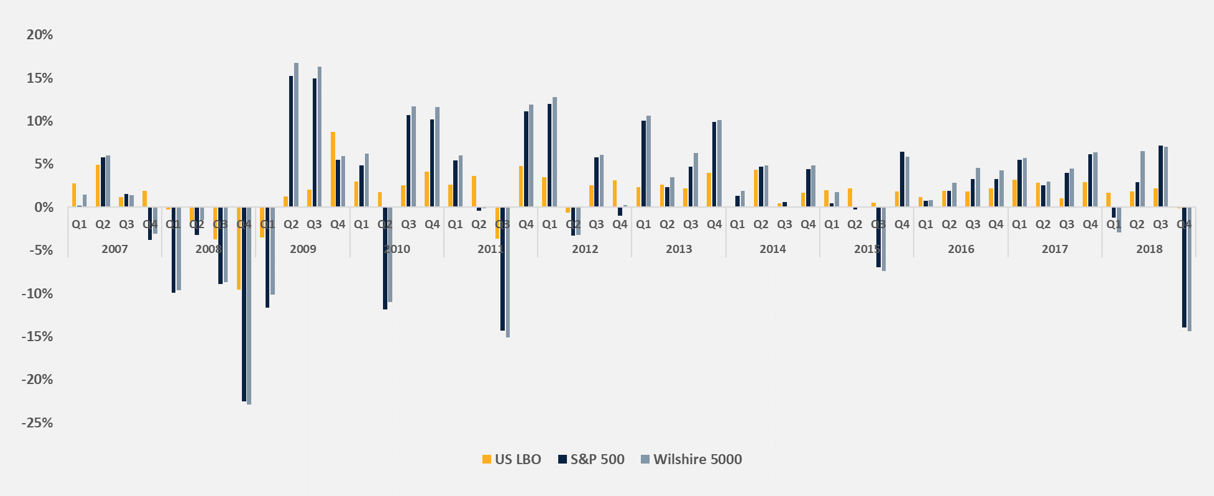
Source: CBOE, Federal Reserve of St. Louis, eFront Insight, as of Q1, 2019.
The correlation coefficients during the bullish public market periods are jarring. This measure of co-movement between the US LBO funds performance and the S&P 500 reached 0.787 for the ten-quarter period prior to the market correction in 2001. The correlation with Wilshire 5000 was at a similar level of 0.790 for the same period. The period of market expansion in the mid-2000s produced even higher coefficients. The correlations between the US LBO market returns and S&P 500 and Wilshire 5000 over the period 2006-2008 were 0.909 and 0.904 respectively. These numbers indicate almost perfect co-movement between these markets.
Tarek Chouman, CEO of eFront, commented:
‘Rebalancing the portfolio that comprises private investments is costly and requires time to materialize. Having a full view on the entire portfolio consisting of listed and private market assets requires a deep understanding of co-movements between the two.
‘The quarterly movements of multiples of US LBO funds and major US stock indices appear to be significantly positively correlated, and this observation is further amplified during the bullish market periods immediately before the markets contracted.
‘US LBO funds exhibit consistently lower volatility of performance relative to the public market indices. Fund managers need to see two successive quarters of strong and consistent shifts in public markets to reflect it significantly in their TVPIs. The main philosophy is to adjust portfolio values moderately but in line with the indices, sometimes catching up with sustained strong movements.’