Muzinich & Co: Can you ‘have your cake and eat it too’ in private debt?
Muzinich & Co: Can you ‘have your cake and eat it too’ in private debt?

Under certain conditions, we believe an ‘Arcadian’ portfolio can exist in private debt in which the economic value of the entire portfolio is much higher than the sum of the fair value of each single asset.
By Roberto Violi, Senior Director Financial Markets and Payment Systems Department, Bank of Italy, and Gianluca Oricchio, Head of Parallel Lending and Chief Data Scientist, Muzinich & Co
Advanced credit risk models as a form of human augmentation
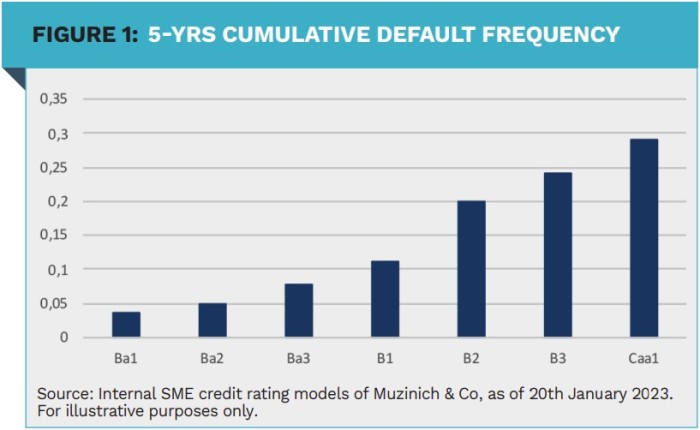
Default risk can be measured via an external credit rating or via internal credit rating models for unrated companies.
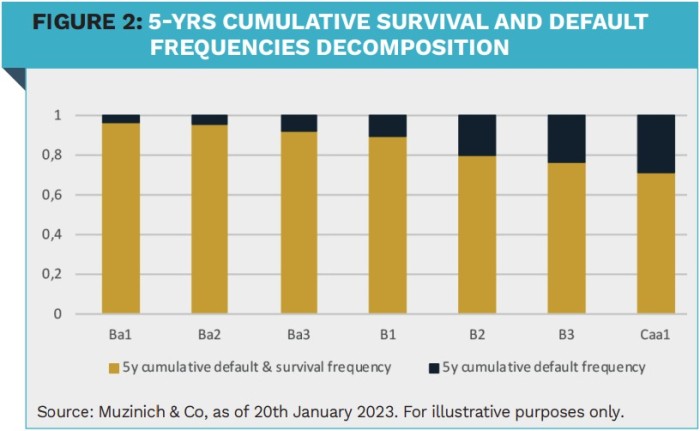
In Figure 1, we show the cumulative default frequencies for private companies. A company rated BB has a cumulative default frequency in the region of 6%, a company rated B is 13%. What is most relevant in identifying the size of the ‘Arcadia’ is the concept of survival probability, namely 100% minus the cumulated default probability. Figure 2 shows the cumulated survival frequencies. A company rated BB has a cumulative survival frequency in the region of 94%, a company rated B around 87%.
The skills in selecting a high yield (HY) equivalent company in an investment grade (IG) equivalent portfolio are strictly related to the asset manager’s screening ability, as well as the accuracy-ratio of his/her adopted credit rating model.
In an ideal world, should we have credit models with a 100% accuracy ratio, the size of the ‘Arcadia’ coincides with the size of the market minus the assets that will enter default (Figure 2). This level of selection skill is currently not reachable, and (very likely) never will be. However, the higher the explanatory power of the credit rating models, the greater the size of the ‘Arcadia’.
According to our applied research and experience with credit rating models – based on both logistic regressions and multilayer neural networks (deep learning) – we see a progressive improvement in the screening accuracy of the internal credit rating models. In our view, the progress in model-based credit risk turns out to be a clear sign of a form of human augmentation complementing the credit analyst’s qualitative assessment.
The better the human augmentation factor performance, the greater the size of the ‘Arcadia’ market share. We believe that, by-and-large, the ‘Arcadia’ market share can be quantified in some 25-30% of the BB-equivalent universe. According to our experience, an increase of the area-under-curve from 84% to 94% is sufficient to identify 100+ BB-equivalent SMEs, presenting at the portfolio level a default frequency consistent with the IG-universe (materially below 40bps per year). We expect increasing competition in the asset management industry trying to occupy the ‘Arcadian’ space, in that it is an ‘ideal’ market share that provides, by means of portfolio risk diversification, a source of alpha boosting risk-adjusted performance.
We expect increasing competition in the asset management industry trying to occupy the ‘Arcadian’ risk space.
The valuation paradox: financial versus accounting valuation methods
In the current accounting frameworks (like IFRS, FASB and ASC) the standard valuation method for private debt assets (and loans or bonds) is based on the net present value of future cash flows (or fair value). Each asset is valued according to market parameters, if any, regardless of the fact that it is part of a (private debt) portfolio or not. In other words, current valuation methodology is stand-alone only. This means that the value of a ‘BB-equivalent private debt assets’ is the same, whether part of a non-IG equivalent portfolio or part of an IG-equivalent portfolio.
It is easy to demonstrate that the value of an ‘Arcadian’ portfolio is higher than the sum of the value of the single assets forming the portfolio. The reason is that risk reduction, brought about by portfolio diversification (default correlation being below one), implies a lower required (market) rate of return.
The value of an HY-equivalent risk private debt asset is the net present value of future cash flows discounted at a rate that includes the BB-equivalent credit risk premium.
If you put together over 100 HY-equivalent risk private debt assets, the aggregate value seems to be the sum of each asset valuation. In other words, adding-up asset values implies that default correlations (below one) are ignored. However, should all the HY-equivalent private debt assets produce an IG-equivalent risk portfolio, the value of the portfolio is the net present value of future (cumulated) cash flows, discounted at a rate that should include the A-equivalent credit risk premium rather than the BB-equivalent one.
The apparent paradox is that for each HY-equivalent risk private debt asset we have two different valuations: the stand-alone method and the portfoliorelated method. So, which is the correct value to calculate the portfolio net asset value?
What is most relevant in identifying the size of the ‘Arcadia’ is the concept of survival probability.
The discount rate should incorporate the A credit spread because, in our view, financial economics dictates that cash flows are discounted at a rate that reflect actual portfolio risk, with default correlation properly accounted for. On the other hand, if you have to assess the value of a single asset in isolation (for instance outside a portfolio) the correct valuation strategy is the standalone method (cash flows discounted at a rate incorporating the BB credit spread).
Can you have your cake and eat it too? Almost, as we can argue that in the ‘Arcardian’ portfolio credit risk improves from HYequivalent risk to IG-equivalent risk, generating a capital appreciation not captured in standard accounting methodology or some valuation metrics (some of them are also found in the regulatory space). We can summarize with a simple formula the message of this article:
Value of an ‘Arcadian’ Portfolio = Sum of the standalone value of each private debt asset + net present value of the benefits of the credit risk gap between IG-equivalent risk and HY-equivalent risk.
|
SUMMARY We define an ‘Arcadia’ in private debt as a portfolio having (i) 100+ HY-equivalent risk investments (ii) delivering a High Yield return and (iii) having an Investment Grade-equivalent risk at portfolio level. The use of artificial intelligence based models can identify and expand the size of the ‘Arcadia’ in private debt. The economic value of an ‘Arcadian’ portfolio is much higher than the sum of the fair value of each single asset. |
|
Disclaimer This material is not intended to be relied upon as a forecast, research, or investment advice, and is not a recommendation, offer or solicitation to buy or sell any securities or to adopt any investment strategy. The opinions expressed herein are as of January 2023 and may change without notice. For Professional Clients/Qualified & Accredited In- vestor use only. Not for public distribution. This material has been produced for information pur- poses only and as such the views contained herein are not to be taken as investment advice. Opinions and statements offinancial market trends that are based on market conditions are being made avail- able for information purposes and no assurances are made as to their accuracy. Such opinions are as of date of publication and are subject to change without reference or notification to you. Past per- formance is not a reliable indicator of current or future results and should not be the sole factor of consideration when selecting a product or strategy. Issued in the European Union by Muzinich & Co. (Ireland) Limit- ed, which is authorized and regulated by the Cen- tral Bank ofIreland. Registered in Ireland, Company Registration No. 307511. Registered address: 32 Molesworth Street, Dublin 2, D02 Y512, Ireland. The views and opinions expressed and conclusions drawn are those of the authors as of January 2023 and do not necessarily reflect the views of the Bank of Italy/CSR or Muzinich & Co. |
Bijlagen
Deel dit bericht
Gerelateerde berichten
-
 Lees meer over "Invesco: Investing in the European upper middle market"
Invesco: Investing in the European upper middle market
-
 Lees meer over "Harry Geels: The end of banking (as we know it)"
Harry Geels: The end of banking (as we know it)
-
 Lees meer over "Evergreen-fondsen doorstaan de test in onrustige private debt-markt"
Evergreen-fondsen doorstaan de test in onrustige private debt-markt
-
 Lees meer over "Ronde tafel 'Specialty Finance & Opportunistic Credit'"
Ronde tafel 'Specialty Finance & Opportunistic Credit'
-
 Lees meer over "Private debt blijft ook onder de Wtp aantrekkelijk"
Private debt blijft ook onder de Wtp aantrekkelijk
-
 Lees meer over "Mercer: Private credit in perspectief - ruis, headwinds en kansen"
Mercer: Private credit in perspectief - ruis, headwinds en kansen
-
 Lees meer over "Troviq Private Markets: Private debt headlines misread market reality"
Troviq Private Markets: Private debt headlines misread market reality
-
 Lees meer over "Pemberton AM: Private credit’s next chapter - measurable impact"
Pemberton AM: Private credit’s next chapter - measurable impact
-
 Lees meer over "Ronald Verhagen (AF Advisors): Een meltdown in private credit – is this time different?"
Ronald Verhagen (AF Advisors): Een meltdown in private credit – is this time different?
-
 Lees meer over "Gerd-Jan van Wiggen: Van private credit naar publieke crisis"
Gerd-Jan van Wiggen: Van private credit naar publieke crisis