eFront: Shorter holds equal better performance for buyout funds
eFront: Shorter holds equal better performance for buyout funds

eFront’s latest data shows that for buyout funds of all sizes, the longer the holding period, the lower the performance
eFront, the leading financial software and solutions provider dedicated to Alternative Investments, has published its latest research on private equity, venture capital, real estate and other alternative asset vehicles, comprising data from more than 4,000 funds globally.
Key findings:
•The longer the holding period for buyout funds of any size, the lower the performance
•Conversely, the longer the holding period for mezzanine funds, the better the performance, as interest is accumulated over time
•For venture capital funds, performance peaks for holding periods in the mid-range, while long and short holds see lower returns
•Overall, small and mid-market buyout funds have a similar time-to-liquidity to large and mega-buyout funds
•Late-stage and balanced venture capital funds, meanwhile, have a shorter time-to-liquidity than their early-stage counterparts
Analysis
Fully realized buyout funds, regardless their size, show a consistent picture: the longer the exposure, the lower the multiple achieved. For US small and mid-market buyout funds, those with the minimum time-to-liquidity see returns of 2.64x (TVPI), while those with the longest holds return just 1.3x. For large and mega-buyout funds the figures are 1.95x and 1.35x respectively (see Figure 1).
The pattern is very similar for European buyout funds. Small and mid-market vehicles with the shortest time-to-liquidity return 2.36x, while those with the longest holds return 1.59x. For large and mega-buyout funds the figures are 1.99x and 1.5x respectively. It is important to note, however, that these figures are based solely on data from traditional 10-year buyout funds. The performance of longer-life funds, which hold portfolio companies for longer periods as a core element of their strategy, cannot therefore be inferred from this data.
Fig. 1 – Valuation of multiple of invested capital and time-to-liquidity of fully realized private markets funds
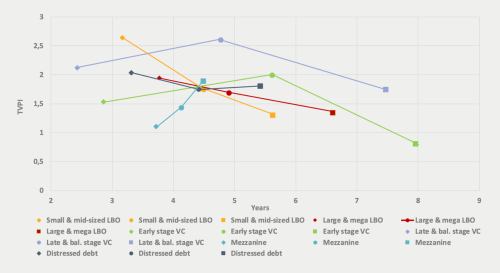
Source: eFront Insight, As of Q2 2019
In the case of 10-year funds, longer ownership periods might reflect more challenging economic conditions, as buyout funds hold investments for longer in order to ride out periods of uncertainty. Interestingly, this is not true for distressed debt. Although shorter time-to-liquidity might reflect opportunistic acquisitions driven by specific macro conditions, it appears that the average and maximum deliver similar performance. This illustrates the necessity to hold companies for a fairly long time to be able to successfully execute a turnaround.
For venture capital, the picture is different, with US funds in the mid-range of time-to-liquidity showing the best performance both for early and late-stage funds. Mezzanine funds, meanwhile, show a specific profile. The longer the time-to-liquidity, the better the performance. This sounds fairly logical, as interest is accumulated over time. If the debt is repaid early, a fund’s overall compensation is likely to be lower. As for conversion rights, they are more likely to be lucrative if the deals that are supported have the time to unfold. It is interesting to note that in that respect, the maximum performance and time-to-liquidity of mezzanine funds corresponds to the average time-to-liquidity of LBO funds.
Looking at the pooled average performance of private markets funds and their corresponding time-to-liquidity, eFront’s data shows that the range is quite broad, from 3.03 years for mezzanine funds to 7.03 years for core private real estate funds (Figure 2). Compared with other asset classes such as infrastructure, real estate and mezzanine, LBO and VC funds of all sizes and stages appear to be grouped in a similar area, exhibiting strong returns and relatively swift time-to-liquidity.
Fig. 2 – Multiple of invested capital and time-to-liquidity of private markets funds
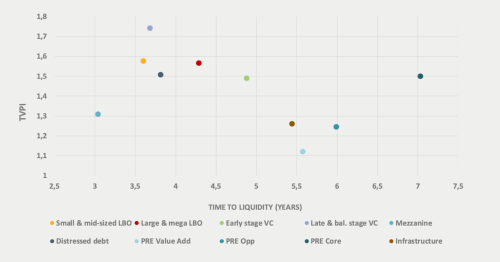
Source: eFront Insight, As of Q2 2019
Deel dit bericht
Gerelateerde berichten
-
 Lees meer over "Ocorian: Family offices are boosting their exposure to alternative assets"
Ocorian: Family offices are boosting their exposure to alternative assets