BNY Mellon: Volatility And Seasonality
BNY Mellon: Volatility And Seasonality
By Simon Derrick, Chief Currency Strategist
- Seasonal patterns of realized volatility in equity markets in H1 noticeable since start of 2015
- Similar pattern for realized volatility in USD Index
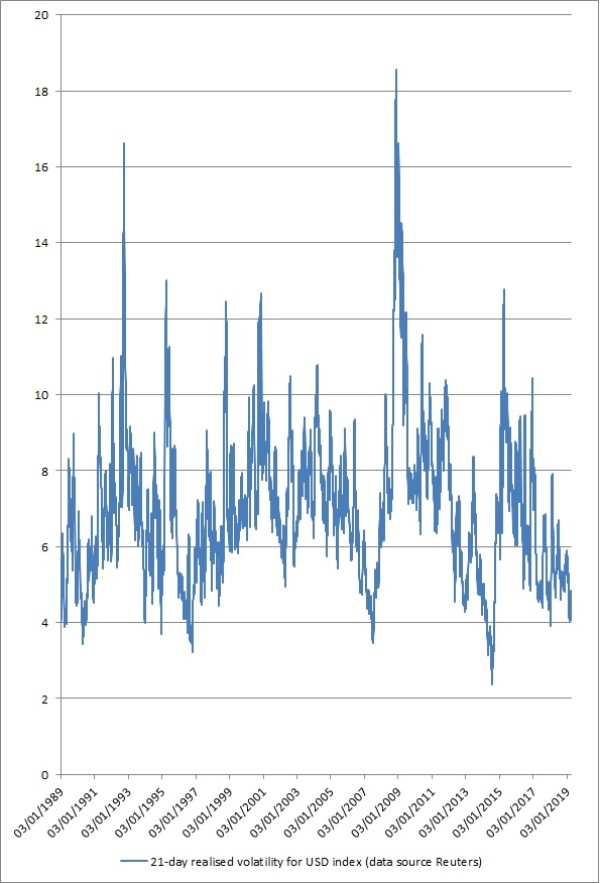
- May, June and July have been months with the highest numbers of days with readings of ultra-low volatility for USD Index over past 30 years
Since global markets began to stabilize in early January, there has been a notable decline in realized volatility in the FX markets from what were already modest levels.
As just one measure of this, 21-day realized volatility in the USD Index has declined from 5.9% to below 4.2%. This, in turn, broadly repeats a pattern seen over the previous four years. What does this say about the FX market over the next quarter?
At the start of 2015 the key forces had proved to be a collapsing oil price and some radical shifts in European monetary and currency policy (notably by the ECB and SNB), while in early 2016 much of the focus had centered on Chinese currency policy.
These factors, in turn, fed into heightened volatility in key stock indices (the S&P 500 dropped 3.1% m/m in January 2015 and just over 5% 12 months later) and then through into the FX markets. This volatility subsided in both cases as it became clear that the FOMC would adopt a more cautious approach over the remainder of the year.
The rise in volatility in 2017 differed from that seen in the previous two years to the extent that it had little to do with heightened uncertainty in the equity markets. Instead, it seemed to be connected to changing attitudes towards the USD itself.
Having started the year at its highest level in a decade-and-a-half, a resumption of the dominant trend towards yield curve flattening - along with some uncertainty around the new US administration’s attitude towards currency policy - saw the USD Index reverse trend resulting, unsurprisingly, in a rise in volatility. However, as the trend towards yield curve flattening and a weaker USD became rather more established, realiZed volatility dropped to levels last seen in 2014.
Last year saw something of a repeat of the pattern set in 2015 and 2016 with a rise in uncertainty in equity markets feeding through into increased risk aversion in the FX markets, only to subside by the time the second quarter of the year had commenced. The pattern of volatility in equity markets also fitted into a reasonably well-established seasonal pattern since 1970.
This year appears to be conforming to the pattern established since 2015 with a spike in equity market volatility at the turn of the year feeding directly into heightened FX volatility that, in turn, was rapidly crushed as the Fed reacted rapidly to the warning signals being generated.
There are several interesting points to be pulled from this. The first is that seasonal patterns of volatility in US equity markets have, if anything, become rather more entrenched over the past half a decade, with high volatility emerging around the turn of the year on four out of the past five occasions.
The second point to be made is that while January and February have proved the rockiest months during the first half of the year for US equity markets since 1970, April and June have proved the most benign. While history does not necessarily provide a guide to what happens next, this pattern of a benign second quarter has certainly held over the past five years.
The third point to be made is that while realized volatility in the USD Index has shadowed these moves in equity market volatility (with 2017 the only real exception), it’s noticeable that the broad trend in the peaks seen early on in the year has been lower.
While 21-day realized volatility in the USD Index peaked out north of 12% in early 2015, and approached 8% last year, this year’s peak couldn’t even make it to 6%.
The final point to be made is that over the past 30 years there have been only 231 trading days that have seen readings of 21-day realized volatility in the USD Index below 4%. July has proved the quietest month (accounting for 47 days below 4%) followed by June (33 days) and May (32 days).