Fidelity: Why some tech valuations may be lower than you think
Fidelity: Why some tech valuations may be lower than you think
 AI artificial intelligence cloud")
Technology stocks have propelled the market’s rally to record highs this year, receiving an inadvertent boost as Covid-19 lockdowns forced the world onto digital platforms for work, education, and entertainment. That resulted in a narrowing of market leadership that has raised concerns around the sustainability of sometimes lofty valuations. But a closer look at longer-term valuations reveals some surprising trends in tech.
The strong performance of technology stocks has drawn excitement as well as skepticism among investors this year. Market performance has been especially narrow: consider that the top five drivers in the S&P 500 (Nvidia, Microsoft, Facebook, Amazon and Apple) have contributed 11 per cent of the index’s year-to-date returns, a bigger share than ever before. And most technology stocks have outperformed the S&P’s relatively modest 5 per cent year-to-date return.
But drill down into the numbers and it becomes clear that even within tech, the valuation picture is mixed. This week’s Chart Room shows a wide dispersion in valuations among S&P 500 stocks in the internet, software, hardware and semiconductor space. Our proprietary valuation score uses forward price-to-earnings relative to the overall index, enterprise value-to-sales, and price-to-book ratios, then compares the average of these measures to the company’s history of up to 15 years. The result is a decile score, with a 1 meaning it’s in the bottom 10 per cent of its valuation history.
While it may not be surprising that many tech companies are at the high end of their historical valuations, it is quite revealing to note the lineup of names that have seen strong recent returns but are still closer to the low end of their historical valuations; that includes giants like Facebook and Alphabet.
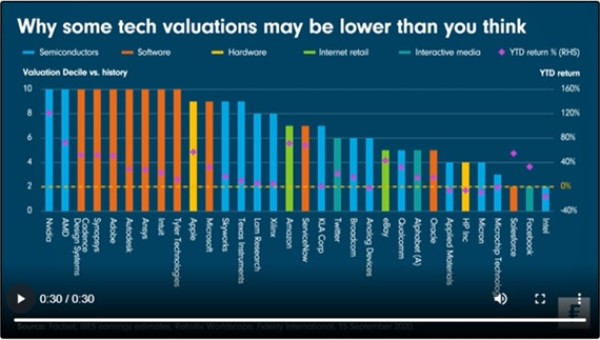
Of course, many cheap stocks are priced that way for a reason, so we don’t rely on this measure for systematic trading or portfolio rebalancing. In fact, our back-tests show that using valuation relative to history as the sole criteria for investment decisions tends to underperform. Another caveat to the above valuation score is that it applies the same methodology across stocks which are in different industries and different stages of their product lifecycles. Certain metrics like earnings ratios may need to be adjusted depending on the company’s specific situation, and that’s where our research analysts can add real value.
Quantitative tools like this are most effective for idea generation and number-crunching, which frees up time to examine the specific qualitative factors around a company. When we identify outliers that appear especially cheap, that could be a hint that certain stocks are worth looking into. In short, we believe quantitative tools are best used as an overlay within the overall investment process, rather than the main determinant for stock selection.
Deel dit bericht
Gerelateerde berichten
-
 Lees meer over "Onguard: IT-afdeling staat digitalisering finance-afdeling in de weg"
Onguard: IT-afdeling staat digitalisering finance-afdeling in de weg
-
 Lees meer over "Young Professionals over AI: Chong Peng (Van Lanschot Kempen)"
Young Professionals over AI: Chong Peng (Van Lanschot Kempen)
-
 Lees meer over "Columbia Threadneedle: Europese telecombedrijven komen in beter vaarwater"
Columbia Threadneedle: Europese telecombedrijven komen in beter vaarwater
-
 Lees meer over "Janus Henderson: Elektriciteitskrapte belemmert AI-aangejaagde groei datacenters"
Janus Henderson: Elektriciteitskrapte belemmert AI-aangejaagde groei datacenters
-
 Lees meer over "Young Professionals over AI: Lieke van der Horst (Pensioenfonds PPF APG)"
Young Professionals over AI: Lieke van der Horst (Pensioenfonds PPF APG)
-
 Lees meer over "AFM en DNB: De impact van AI in de financiële sector en het toezicht daarop"
AFM en DNB: De impact van AI in de financiële sector en het toezicht daarop
-
 Lees meer over "Svetlana Borovkova: Finetuning LLMs for financial applications"
Svetlana Borovkova: Finetuning LLMs for financial applications
-
 Lees meer over "Mazars: Bedrijven moeten zich bewust zijn van digitale verantwoordelijkheid"
Mazars: Bedrijven moeten zich bewust zijn van digitale verantwoordelijkheid
-
Lees meer over "Onguard: Binnen 29% van de organisaties nog altijd geen digitale transformatie"
Onguard: Binnen 29% van de organisaties nog altijd geen digitale transformatie
-
 Lees meer over "Janus Henderson: Productiviteitswinst dankzij AI houdt inflatie onder controle"
Janus Henderson: Productiviteitswinst dankzij AI houdt inflatie onder controle