WisdomTree: Cautious optimism about Chinese equities
WisdomTree: Cautious optimism about Chinese equities

By Mobeen Tahir, Associate Director, Research, WisdomTree
Breakneck gains in stock markets create excitement, but also raise fears of bubbles. There are good reasons for the strong ongoing rally in Chinese equities, and – although risks lurk on the horizon – we aren’t in bubble territory.
The tailwinds
The S&P China 500 Index is up 17.7% and the CSI 300 Index is up 16.8% year-to-date[1]. The recovery in Chinese equities, following the sharp drawdown in the middle of March this year, can be broken down into three phases:
- Initial recovery due to policy support: The People’s Bank of China (PBOC) responded to the economic crisis with cuts in reserve requirements and lending rates, and by introducing targeted lending to distressed sectors. This monetary lifeline was supported further by the 4 trillion yuan (US$559 billion) fiscal stimulus announced by the Chinese government in May.
- The tipping point: Policy firepower was in the tank, but equity markets were eagerly awaiting positive economic data as lockdown conditions were eased in China. Strong manufacturing and services Purchasing Managers Index (PMI) numbers for June released in the first week of July provided a boost to risk sentiment triggering a sharp rally.
- The uptick in margin trading: In China, margin trading on the stock market has a high correlation with the stock market itself. Total outstanding balance of margin transactions in China, a measure of speculative trading, has risen sharply in July propelling the rally further.
Figure 01: Margin trading in China can have a strong bearing on the stock market
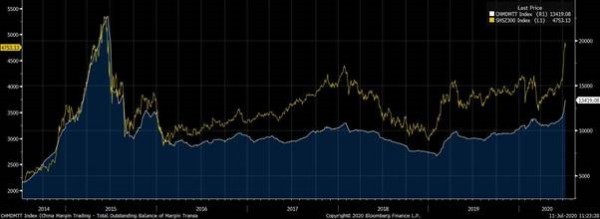
Source: Bloomberg, data from 13/07/2014 to 11/07/2020. CHMDMTT Index refers to China Margin Trading – Total Outstanding Balance of Margin Transactions (Right axis, in 100 million China Renminbi). SHSZ300 Index refers to the CSI 300 Index (Left axis, in China Renminbi).
Historical performance is not an indication of future performance and any investments may go down in value.
The risks ahead
Prudent investors would recognise the following risks:
- The economic challenge is not overcome yet: The Chinese economy contracted 6.8 year-on-year in the first quarter of 2020. Annual inflation rate rose from 2.4% in May to 2.5% in June. Despite the improvement in PMIs, the all-important reading of gross domestic product (GDP) growth for the second quarter may still be a humbling one. It may remind markets that the challenge of achieving an economic recovery will only be overcome gradually.
- The return of trade wars: Recent US sanctions on Chinese officials for human rights violations in the western region of Xinjiang may be symbolic, but they have further raised the temperature between the two nations. China has already announced its intention to respond in kind by sanctioning US officials. The all-important trade relationship between the two countries remains perilous and could deteriorate again.
- Sentiment can shift quickly: Stock market rallies that are stoked by retail sentiment can switch directions quickly. Memories of 2008 and 2015 remain fresh in the minds of observers analysing Chinese stock markets.
Not quite in bubble territory yet
One possible way to study stock market bubbles – if only ex-post – is to observe the surge in valuation multiples. While price-to-earnings (P/E) multiples for Chinese stocks have indeed risen in July, they remain far from alarming levels seen during previous stock market bubbles. It also does not seem unreasonable to expect earnings for Chinese businesses to improve as the economy recovers in the second half of this year. This too, could help keep valuation multiples in check.
Under a pragmatic approach, investors should maintain optimism about an improving macroeconomic outlook, but remain cognisant of the risks which may still create volatility.
Figure 02: Chinese valuation multiples have risen, but not to alarming levels
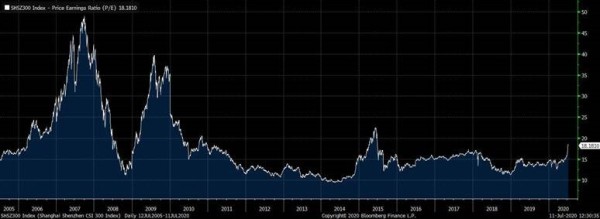
Source: Bloomberg, data from 12/07/2005 to 11/07/2020. SHSZ300 Index refers to the CSI 300 Index. Historical performance is not an indication of future performance and any investments may go down in value.
Deel dit bericht
Gerelateerde berichten
-
 Lees meer over "LGIM: Onderwogen posities in Indiase en Chinese staatsobligaties bieden kansen"
LGIM: Onderwogen posities in Indiase en Chinese staatsobligaties bieden kansen
-
 Lees meer over "Capital Group: Hoe bevolkingsafname de wereldeconomie kan ontwrichten"
Capital Group: Hoe bevolkingsafname de wereldeconomie kan ontwrichten
-
 Lees meer over "Fidelity: Chinese sportkledingsector loopt op kop"
Fidelity: Chinese sportkledingsector loopt op kop
-
 Lees meer over "Fidelity: Waarom Chinese beleggers dol zijn op ultralange obligaties"
Fidelity: Waarom Chinese beleggers dol zijn op ultralange obligaties
-
 Lees meer over "UBS AM: Optimisme over Chinese aandelen"
UBS AM: Optimisme over Chinese aandelen
-
 Lees meer over "Han Dieperink: We gaan steeds meer op China lijken"
Han Dieperink: We gaan steeds meer op China lijken
-
 Lees meer over "Payden & Rygel: 2024 - The Year of the Dragon"
Payden & Rygel: 2024 - The Year of the Dragon
-
 Lees meer over "Mainfirst: Is het de moeite waard om in China te beleggen?"
Mainfirst: Is het de moeite waard om in China te beleggen?
-
 Lees meer over "State Street: Economic Parallels - Is China the next Japan?"
State Street: Economic Parallels - Is China the next Japan?
-
Lees meer over "Swissquote: China travels & spends more than pre-pandemic"
Swissquote: China travels & spends more than pre-pandemic