NN IP Green Bond Bulletin: Performance data confirm green bonds are becoming mainstream
NN IP Green Bond Bulletin: Performance data confirm green bonds are becoming mainstream

- Green bond indices’ returns and volatility show that impact does not have to cost returns
- Increasingly low barriers to replace regular bonds with green corporate bonds in portfolios
- An active approach can further enhance positive performance
Market data confirm that the appeal of green bonds is increasing for a broader range of investors. We analysed index-level performance for the last four years and are convinced that green bond markets deserve to be assessed in a broader bond-market context. The returns and volatility, especially of corporate green bonds, make them a viable replacement for regular bonds in a credit portfolio.
NN Investment Partners’ Green Bond Bulletin brings you the latest developments in this growing market. We review recent market developments, give an update on new issuance and our activities, and look ahead with our portfolio managers. In this edition we focus on performance.
More and more investors are allocating to green bonds in their portfolios. Their aim is often to make it clear and transparent to their stakeholders, for example, pension participants, that they are greenifying their investment portfolio. But we believe that a broader range of investors could consider replacing parts of their bond portfolio with a green bond allocation, on the basis of their appealing risk-return profile.
We analysed how green bond indices performed compared to regular indices for euro green bonds and euro corporate green bonds. We have included only the last four years in our analysis as we think the green bond market was too underdeveloped before 2016 to make a comparison.
Outperformance and more volatility
Figure 1 shows how the Bloomberg Barclays MSCI Euro Green Bond Index has performed compared to an index of euro-denominated corporate and sovereign bonds (Bloomberg Barclays MSCI Euro Aggregate Index). In 2019 green bonds generated returns of 7.4% compared to 6.0% for regular bonds. Euro green bonds outperformed for three of the four years, by an average of 0.70% per year. Figure 2 shows that the annual volatility of the green bond index was higher for three of these years. This means that the higher returns were largely the result of higher risk.
Figure 1: Annual returns
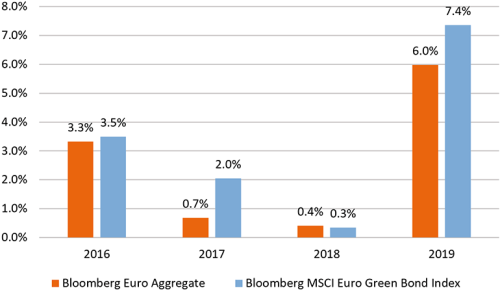
Source: Bloomberg, NN Investment Partners
Figure 2: Annual volatility
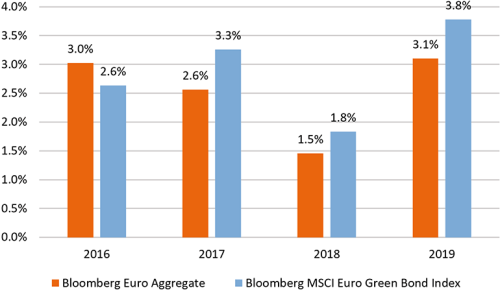
Source: Bloomberg, NN Investment Partners
Figure 3 shows the duration of both euro indices over the past four years. It shows that the duration of the Bloomberg Barclays MSCI Euro Green Bond Index increased significantly in early 2017. At that time, the inclusion of the Republic of France’s first green government bond in the index had a big impact. This was a large issue (EUR 7 billion) and the bonds had a 22-year lifetime, hence their effect on the index’s duration. This higher duration means that green bonds are more sensitive to interest-rate changes. And as interest rates continued to fall last year, the Bloomberg Barclays MSCI Euro Green Bond Index outperformed the regular Bloomberg Barclays MSCI Euro Aggregate Index over 2019.
Figure 3: Euro Green Bond Index – Duration
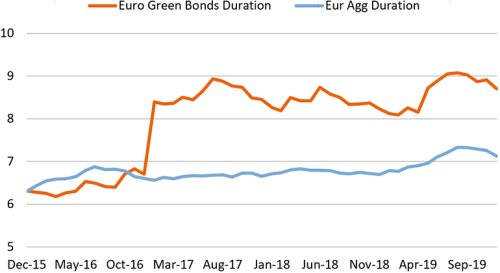
Source: Bloomberg, NN Investment Partners
Corporate Green Bonds – similar duration, better performance
Although the green bond market as a whole has grown significantly in recent years, the corporate segment has experienced particularly strong growth. This growth is also reflected in the breadth of the market, where an increasing number of industry segments are now represented. By comparing the Bloomberg Barclays MSCI Euro Green Bond Index: Corporate to the Bloomberg Barclays Euro Aggregate Corporate Index, we can make the same comparisons as in Figures 1 and 2.
Figure 4: Annual returns
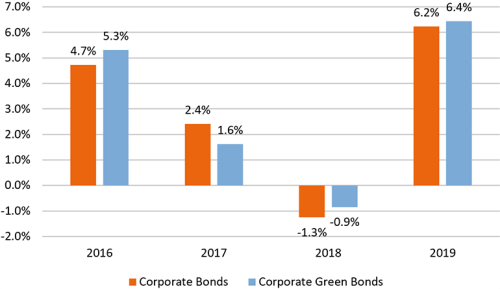
Source: Bloomberg, NN Investment Partners
Figure 5: Annual volatility
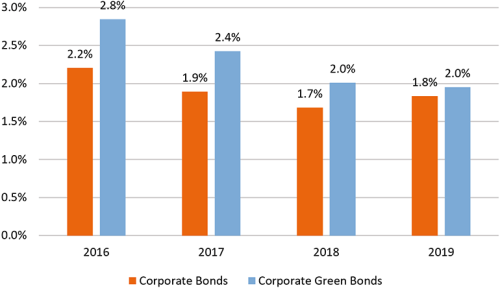
Source: Bloomberg, NN Investment Partners
In 2019, corporate green bonds booked returns of 6.4% compared to 6.2% for regular bonds and outperformed in three of the four years (2016, 2018, 2019). The annual volatility was also higher for all four years but in the case of corporate bonds this gap has become smaller each year.
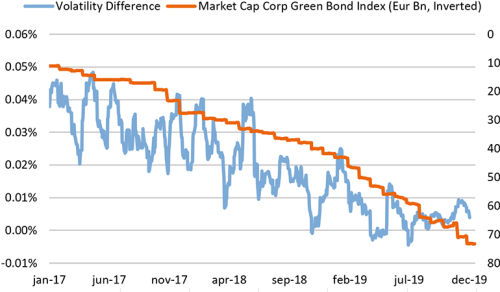
Given the strong divergence in annual volatility, we also compared the daily volatility of these two indices over the past four years (Figure 6). The blue line indicates that the difference is trending consistently downward, meaning that, in terms of volatility, the green and non-green indices are moving towards each other. We believe the reason for this convergence is the growth (shown on the right axis) and increased diversification of the corporate green bond market. The duration of the two indices is now more or less the same.
Figure 6: Daily volatility difference – corporate green bonds vs regular corporate bonds
Source: Bloomberg, NN Investment Partners
What does this mean for investors?
The results of this analysis strengthen our belief that investing in green bonds is an easy way to invest in fixed income more sustainably without having to compromise on performance. Over the past four years, green bond indices have in general performed better than traditional indices. Green bonds are typically issued by innovative, forward-looking issuers, whose activities are adapting to the urgency of climate change. As a result, these companies are less exposed to climate and ESG risks and are more transparent in their activities. The consistent outperformance of green bond indices versus regular bond indices underscores this and also makes a compelling argument for green bonds in a broader context.
While in the case of the broader index that includes corporate and sovereign bonds, volatility was stable or rising, the situation is different for corporate green bonds. The results here show that the volatility of the corporate green bond index has been consistently moving closer to that of the traditional bond index. This shrinking volatility differential means that the barriers to replacing a portfolio of traditional corporate bonds with a portfolio of corporate green bonds have also diminished. The arguments are tipping in favour of corporate green bonds – not just as a way to create impact but also from a purely financial and risk-return perspective.
Deel dit bericht
Gerelateerde berichten
-
 Lees meer over "Winners Morningstar Awards for Investing Excellence 2024 Netherlands"
Winners Morningstar Awards for Investing Excellence 2024 Netherlands
-
 Lees meer over "DNB: Nederland Europees koploper in uitgifte groene obligaties"
DNB: Nederland Europees koploper in uitgifte groene obligaties
-
 Lees meer over "Achmea IM: Kwartaalupdate Green Bonds Q2 2023"
Achmea IM: Kwartaalupdate Green Bonds Q2 2023
-
 Lees meer over "Aegon AM: Verstevigde positie in Nederlandse markt"
Aegon AM: Verstevigde positie in Nederlandse markt
-
Lees meer over "Aegon AM: Verstevigde positie in Nederlandse markt"
Aegon AM: Verstevigde positie in Nederlandse markt
-
 Lees meer over "BNP Paribas: Sociale obligaties voor duurzame economische groei"
BNP Paribas: Sociale obligaties voor duurzame economische groei
-
 Lees meer over "Harry Geels: Zorgen over steeds luidere roep eurobonds"
Harry Geels: Zorgen over steeds luidere roep eurobonds
-
 Lees meer over "PGIM Fixed Income: Despite the rally, attractive values can still be found in a number of areas"
PGIM Fixed Income: Despite the rally, attractive values can still be found in a number of areas
-
 Lees meer over "Deloitte: Success in sustainable investing requires a focus on governance, data and talent"
Deloitte: Success in sustainable investing requires a focus on governance, data and talent
-
 Lees meer over "UBS AM: Uniek klimaat voor beleggers om risico aan te gaan"
UBS AM: Uniek klimaat voor beleggers om risico aan te gaan