eFront: Global venture capital performance reaches all-time high
eFront: Global venture capital performance reaches all-time high

Returns from global venture capital funds reached their highest ever level in Q2 2019, with European funds continuing to set a “new normal” level for returns
eFront, the leading financial software and solutions provider dedicated to Alternative Investments, has published its latest Quarterly Private Equity Performance report, showing that venture capital funds globally reached their best ever performance in Q2 2019, surpassing the previous high recorded one year earlier.
Key findings
- Performance of VC funds globally reached 1.59x in Q2 2019 – the highest level over the last ten years– before dipping slightly to 1.58x in Q3
- 2019 is so far the best ever year for venture capital performance, with high returns associated with moderate levels of risk
- Selection risk in 2019 was higher than the historic average, but remains in line with the level seen in 2014 to 2016, at a TVPI spread of around 1.9x
- Time to liquidity has trended downwards since the record high seen at the end of 2015, but following a slight rise in 2019 now sits at around 3.4 years
- Western European VC funds continue to show strong improvement, significantly outperforming the long-term average and setting a new course away from the historical pattern
- US VC funds, meanwhile, registered a spectacular progression during Q2
Analysis
eFront’s latest Quarterly Private Equity Performance Returns shows that VC returns reached a new high in 2019. Over the course of the last two quarters, multiples on invested capital (TVPI) of active VC funds approached 1.6x (see Figure 1). After a rather stable period of four years during which TVPIs fluctuated between 1.40x and 1.55x, 2019 recorded a substantial increase from 1.53x in Q1 2019 to 1.59x in Q2, followed by a slight decline in the third quarter. This expansion happened in the broader context of a very favorable environment during which listed stocks rallied after a correction in Q4 2018.
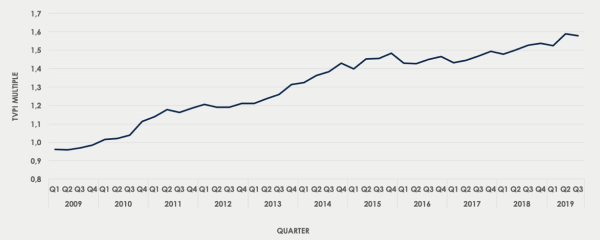
Figure 1 - Return evolution of active VC funds
Overall, the result was driven in part by the best funds increasing performance significantly, but also by poorer performers improving. Thus, all the active funds have benefited from an upward movement, raising the question of how much of this improvement is related to the progression of listed equity valuations.
The increase in pooled performance was also associated with an increase in selection risk, as measured by the TVPI spread between the top and bottom performers. However, risk did not increase to the same degree as performance, meaning that the risk-return profile has in fact improved. Selection risk increased by 12% from 1.73x in Q3 2018 up to 1.93x in Q3 2019, but remains relatively close to levels seen in 2014-16 (see Figure 2).
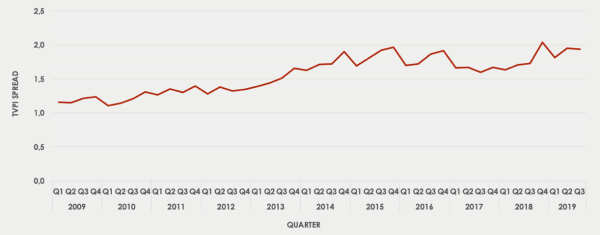
Figure 2 - Risk evolution of active VC funds
Looking at time-to-liquidity, over the years 2016 to 2018, a pattern has emerged, with a sharp drop in time-to-liquidity during the first quarter, followed by three quarters of successive recovery. Nevertheless, the recovery never managed to compensate for the initial descent until 2018. Overall, the trend has been for slight downward trend in time-to-liquidity, thanks in part to the strong exit environment for venture capital in recent years.
So far, 2019 continues this trend, with the first quarter recording a decrease – albeit smaller than those in previous years – followed by successive and more pronounced increases in time-to-liquidity. As a result, the average time-to-liquidity increased from 3.41 years in 2018 to 3.47 in 2019. 2019 and 2018 also signal an overall stabilization of time necessary to generate liquidity at a level of around 3.4 years (see Figure 3).
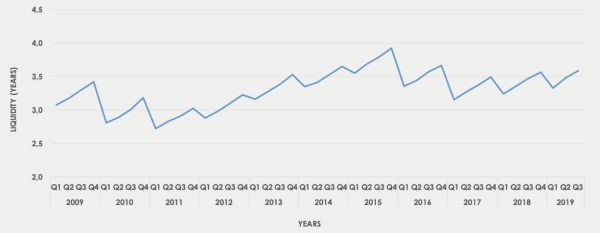
Figure 3 - Liquidity evolution of active VC funds
In the US market, venture capital funds recorded a surge in valuations across the board in Q2, meaning that all recent vintage years now sit on or above the historical average. Western European VC funds, meanwhile, continue their steady increase in performance, with all vintage years since 2010 now outperforming the historical average (see Figure 4). Led by the extremely strong 2010 vintage years, Europe is setting a “new normal” in returns. With the 2011-15 vintage years also looking strong, the continent appears to be setting a new course away from the historical pattern.
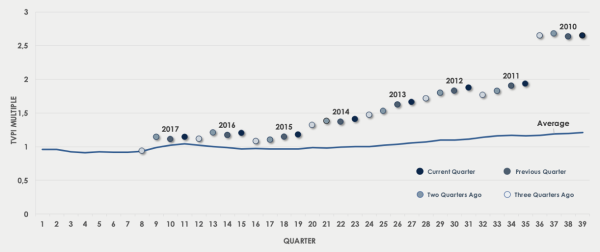
Figure 4 - Evolution of multiples of W. European VC funds
Deel dit bericht
Gerelateerde berichten
-
 Lees meer over "UBS AM: Uniek klimaat voor beleggers om risico aan te gaan"
UBS AM: Uniek klimaat voor beleggers om risico aan te gaan
-
 Lees meer over "Principal AM: Wereldwijde waarderingen van aandelen bieden volop kansen"
Principal AM: Wereldwijde waarderingen van aandelen bieden volop kansen
-
 Lees meer over "Perception A: Institutional investors favour fixed income over equities"
Perception A: Institutional investors favour fixed income over equities
-
 Lees meer over "State Street: Beleggers aarzelen nu aandelenallocatie hoogste punt in 15 jaar nadert"
State Street: Beleggers aarzelen nu aandelenallocatie hoogste punt in 15 jaar nadert
-
 Lees meer over "State Street SPDR ETFs: US Midcap equities – economic exceptionalism at a reasonable price"
State Street SPDR ETFs: US Midcap equities – economic exceptionalism at a reasonable price
-
 Lees meer over "Vanguard: Recordhoogte Amerikaanse aandelen reden voor voorzichtigheid?"
Vanguard: Recordhoogte Amerikaanse aandelen reden voor voorzichtigheid?
-
 Lees meer over "Han Dieperink: Europapa"
Han Dieperink: Europapa
-
 Lees meer over "La Française: Which asset classes are likely to benefit from lower rates?"
La Française: Which asset classes are likely to benefit from lower rates?
-
 Lees meer over "UBS AM: Optimisme over Chinese aandelen"
UBS AM: Optimisme over Chinese aandelen
-
Lees meer over "Global Data: Germany VC landscape thrives despite volume decline"
Global Data: Germany VC landscape thrives despite volume decline