PineBridge Investments: EM Corporate Bonds - the new core fixed income staple
PineBridge Investments: EM Corporate Bonds - the new core fixed income staple
 - Visual.jpg")
By Steve Cook, Co-Head of Emerging Markets Fixed Income, London, and Jonathan Davis, Client Portfolio Manager, Emerging Markets Fixed Income, New York
Unprecedented policy support from central banks and governments around the world helped stabilize markets in the face of COVID-19 in 2020, prompting economic activity to resume, and contributing to a historic decline in bond yields.
|
SUMMARY
Higher interest rate volatility and low yields continue to challenge investors seeking to achieve stability and income throughout a market cycle.
In this environment, certain areas of EM debt have a place in core fixed income allocations, on par with another portfolio staple: US dollar investment grade bonds.
EM investment grade debt issued by EM corporate and sovereign issuers in a reserve currency, typically US dollars, could provide a compelling opportunity set for fixed income investors.
|
This year, concerns that demand-focused fiscal stimulus may lead to an overheating of economies have caused bond yields to rise. But while rates have broken out of their 2020 ranges, high levels of government debt across developed markets, paired with systemically low rates of inflation, are likely to prolong the low-rate environment.
Investors are thus grappling with heightened interest rate volatility in what is still a low-yield environment by historical standards. This means they must reevaluate their core fixed income allocations to ensure that they keep delivering both stability and income throughout a market cycle.
We believe that in this environment, certain areas of emerging market (EM) debt have a place in core fixed income allocations, on par with another portfolio staple: US dollar investment grade bonds. Specifically, we view the $2.5 trillion universe1 of investment grade debt issued by EM corporate and sovereign issuers in a reserve currency, typically US dollars, as a compelling opportunity set for core fixed income investors.
How do yields and spreads measure up?
The first point of comparison between investment grade (IG) hard-currency EM debt and US core fixed income is naturally yield – specifically, the potential for EM debt to help solve the challenge of historically low bond yields. Over the past decade, hard-currency investment grade EM debt has typically offered investors roughly 1.10% of excess yield over investment grade US credit, with surprising consistency.2
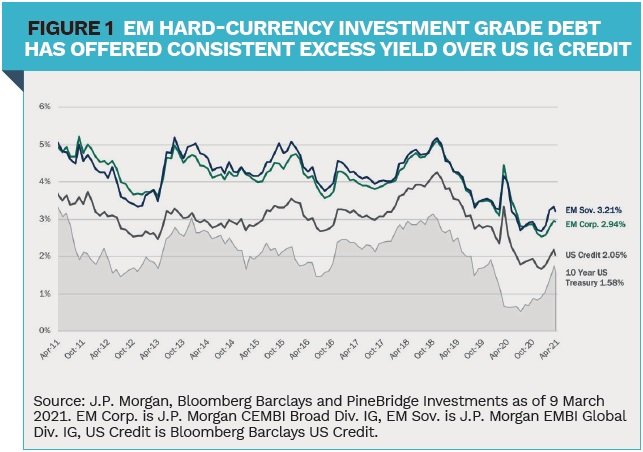
The consistent relationship between yields on EM investment grade debt and US IG credit is important for investors looking to enhance core fixed income portfolio yield without introducing meaningful deviation from internal benchmarks. It is also indicative of a similar relationship in credit spreads. Over the past decade, US investment grade credit spreads have occupied a 183 basis point (bp) range, while the ranges for investment grade EM corporate debt and EM sovereign debt have been 237 bps and 188 bps, respectively.3 Given the similarities in yield and spread, it’s not surprising to observe strong relationships with total returns as well: investment grade EM corporate and sovereign debt have shown 0.88 and 0.85 correlations to US credit since 2010,3 respectively.
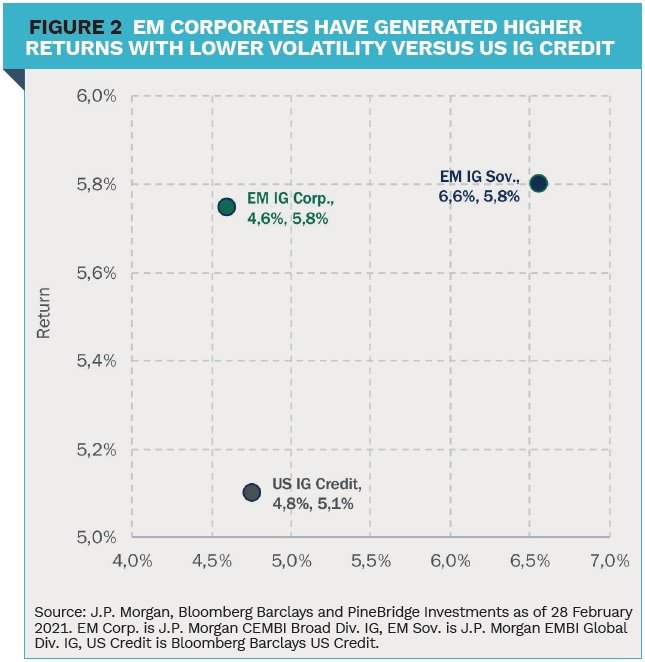
With consistently higher carry and similar trends in credit spreads, investors might assume that invest ment grade EM debt markets have delivered higher total returns in exchange for a similar increase in volatility. However, while both investment grade corporate and sovereign debt have generated higher total returns than US credit over the past decade, EM corporates have actually done so with lower annualized volatility.
The growth of EM debt over the past decade has expanded the universe of investable securities, while the credit quality of the external debt market overall has remained roughly 55-65% investment grade.4 That growth and consistent quality have resulted in rising index inclusion of EM debt, in turn allowing actively managed core FI portfolios to allocate more to EM debt given its presence in portfolio benchmarks. However, this approach tends to limit the benefits EM debt can deliver to core FI portfolios, given that most core fixed income indices remain materially underweight EM debt relative to the size of the investable universe.
While emerging markets represent more than 40% of the global economy and EM debt accounts for just over 22% of overall global bond volumes, EM accounts for less than 13% of the Bloomberg Barclays Global Aggregate Index, and the majority is denominated in local currencies.5 For investors who typically allocate to core fixed income portfolios benchmarked against reserve currencies, the EM exposure tends to be much smaller, as EM accounts for less than 6% of the Bloomberg Barclays US Credit Index.6
Equally important are the characteristics of the EM exposure within core fixed income benchmarks relative to the overall universe available to investors. Here we find a compelling argument in favor of dedicated EM debt exposure as opposed to asset allocation within the context of a portfolio benchmarked against the US credit. Exposure in the Bloomberg Barclays US Credit Index is concentrated in Latin America7 and valuations come up short of what can be found in dedicated EM indices, particularly the EM corporate investment grade index.8
Fundamentals remain supportive
As investors consider the benefits of a dedicated allocation to investment grade EM debt in their fixed income portfolios, they may be encouraged by supportive fundamentals. EM growth will outpace developed market (DM) growth in the post-COVID global recovery – and from a less severe 2020 contraction. From a debt perspective, EM public sector debt-to- GDP is roughly half that carried by DM sovereigns and EM corporates have traditionally carried less leverage on their balance sheets than their DM counterparts.
EM represents 40% of the global economy and that share will approach 50% over the next decade. By 2025, half the world’s large companies will have EM headquarters. As such, EM debt markets will continue to expand and gain greater representation in bond indices and portfolios. Investors should take advantage of the current opportunity to add exposure at attractive levels, as increasing inclusion of EM debt will likely drive a compression of risk premia and outperformance for investors who are ahead of the trend.
1 Source: J.P. Morgan and PineBridge as of 31 December 2020
2 Source: J.P. Morgan and PineBridge as of 09 March 2021
3 Source: J.P. Morgan, Bloomberg Barclays and PineBridge as of 09 March 2021
4 Source: J.P. Morgan as of 31 March 2021
5 Source: IMF, Bloomberg Barclays as of 31 March 2021
6 Source: Bloomberg Barclays as of 31 March 2021
7 Source: Bloomberg Barclays as of 31 March 2021
8 J.P. Morgan CEMBI Broad Diversified
|
Disclosure
Investing involves risk, including possible loss of principal. For professional investor use only, not for retail distribution. The information presented herein is for illustrative purposes only and should not be considered reflective of any particular security, strategy, or investment product. It represents a general assessment of the markets at a specific time and is not a guarantee of future performance results or market movement. This material does not constitute investment, financial, legal, tax, or other advice; investment research or a product of any research department; an offer to sell, or the solicitation of an offer to purchase any security or interest in a fund; or a recommendation for any investment product or strategy. PineBridge Investments is not soliciting or recommending any action based on information in this document. In the UK, this material is issued by PineBridge Investments Europe Limited, Exchequer Court, 6th floor, 33 St Mary’s Axe, London, EC3A 8AA, authorised and regulated by the Financial Conduct Authority.
|